Dashboard
The
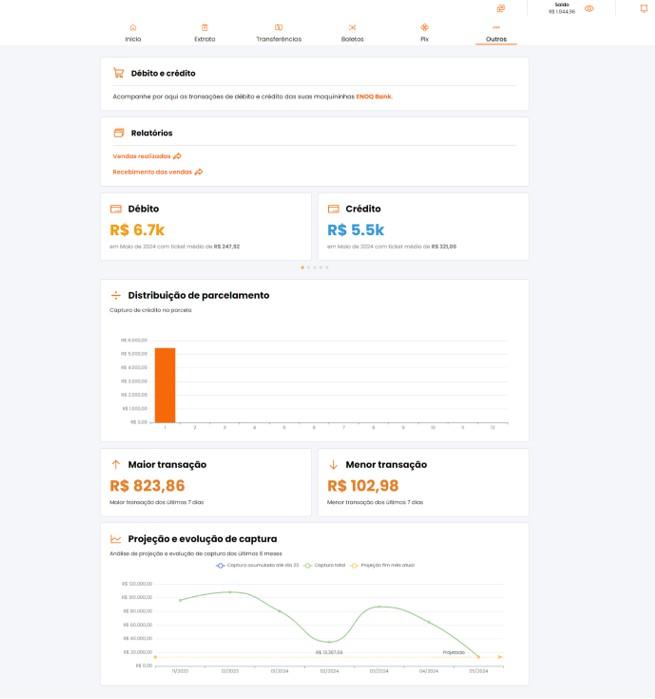
What is shown on the Dashboard?
-
Debit and credit summary
- Provides an overview of transactions made with debit and credit cards.
- Detailed information includes total captured amounts and the average ticket for each payment method.
-
Available reports
- Sales made: A detailed report with information about completed sales.
- Sales receivables: Clear information about completed or expected receivables.
-
Installment distribution
- A chart showing how credit captures are distributed across installment ranges, helping identify purchasing trends.
-
Highlighted transactions
- Displays the largest and smallest transactions in a recent period, helping identify outliers or relevant operations.
-
Capture projection and evolution
- A chart illustrating the evolution of captures over recent months, helping you track performance and identify growth trends or seasonality.
Dashboard benefits
- Clarity and organization: All essential financial data is presented in an intuitive, visual way.
- Data-driven decisions: Clear information helps identify opportunities, detect issues, and plan actions based on financial insights.
- Real-time tracking: Frequent updates help you keep accurate, up-to-date control of your financial operations.
If you need more information about the data shown on the Dashboard or how to interpret it, see our Support Guides or contact our team.